 Homeownership has many benefits: stability, security, and the freedom to make your own space. It also has many financial advantages. Not only will you get the tax benefits of homeownership, but building equity in your home in like a built-in savings plan! For those of you looking to change your home space including upsizing or downsizing, home equity is the highest it has ever been. The average homeowner with a mortgage is sitting on nearly $300,000 in equity! And nearly 40 percent of people own their home, free and clear. Now might be a great time to tap into your home's equity and buy the house you really want! Having a paid off, or almost paid off mortgage might allow you to pay all-cash or only take out a smaller mortgage – which opens a lot of options. You might even consider renting out your current home, but of course consult with your financial advisor and/or C.P.A. before making any move.  When mortgage rates finally start to drop there also will be a flood of eager buyers and sellers. Even now, 32% of buyers are all-cash! If you don’t want to get caught up in that crush, you need to act sooner rather than later to build a solid footing for you and your family by making a smart move. Give me a call or text today if you want to learn about the steps to take now - like what to do to get your current house ready to sell and identify what you want next. DONALD KEYS Selling Homes Since 2006 HomeSmart (602) 750-1744 . If you’re thinking of moving out of the area, I belong to a large network of agents across North America and can connect you with one who will provide the same great service. There are many advantages to homeownership and now could be the best time of the year to make a move. 
0 Comments
 Let's take a quick look at the Real Estate Market for Maricopa County (Phoenix, AZ Metro Area). Real estate prices are still hot, like the temperatures in Phoenix with the Median Sales Price up 3.9% compared to one year ago. The days on market has increased slightly to 45 from 40 last year and the amount of homes for sale has increased to 2.7 months, up from 1.40 months last year. Higher interest rates and incentives from some Sellers are keeping some Buyers on the sideline with 15.7% few homes sold compared to the same time last year. Also the number of homes for sale (Active Listings) are up a whooping 62.6%! Remember The Home Buying Process Is Changing Starting August 2024 so read the article to be prepared! www.thekeysteam.com/market-update/the-home-buying-process-in-2024
If you are looking to Buy or Sell a home feel free to reach out to me directly with all your questions. DONALD KEYS Selling Homes Since 2006 HomeSmart (602) 750-1744 or use my Contact Page and you can always Search The Live MLS here: Search Homes Real Estate Market Update June 2024Do you dream of owning a vacation home? Is there one spot you’ve visited repeatedly or always wanted to and thought, “One day I’d love to have a place here?”. Many people have the same desire. Although demand has declined somewhat, the desire to own a second home is still 35% higher than prior to the pandemic. The whole eco-system of vacation homes has changed with 20% of people now working from home. Many Buyers are using their vacation home as a transition over time to relocate to the area they’ve always dreamed of living in. Now you can use your vacation home as a place to relax, work remotely or as a gathering place for extended family to spend time together. Owning your own vacation home takes the stress out of planning time off. You know where you will be staying, surrounded by your things, in a comfortable environment that you love. And if you plan on retiring to your vacation home, it’ll make the transition very smooth as you’ll be familiar with the neighborhood and all the services you need to support your life. Real estate has always been a great hedge against inflation and a vacation home creates both lifestyle and equity. Now, if you have questions on owning your own vacation home, give me a call or text at (602) 750-1744 - Donald Keys - HomeSmart. I’m part of the most prolific network of real estate professionals in North America and I can help you find a top agent in your vacation home destination!  The Home Buying Process has changed over the years and will change even more in the next 6 months.   Here is a quick overview of the New Home Buying Process for 2024:: 01) PLAN for financial readiness. Understand the costs involved with buying a home. 02) Start your DREAM with an on-line home search. Search just like an agent using the REAL MLS HOME SEARCH I provide. 03) CALL or TEXT ME at (602) 750-1744 to discuss your needs and draw on experience and expert knowledge. 04) MEET or schedule a ZOOM MEETING with me to discuss your priorities and Sign your Buyer Representation Agreement (now required to see homes in person). 05) PREPARE for Pre-Approval and Pre-Qualification. Find out how much home you can afford and create a home budget. 06) SEARCH and receive INSTANT NOTIFICATION of Hot New Listings. Including HOMES you will NOT FIND on ANY OTHER WEBSITE! 07) EXPLORE Homes in person. Remember do not visit any home or NEW HOME MODEL CENTER without your Agent on the FIRST VISIT! Otherwise can be giving up your representation rights and it could cost you alot of money. 08) LOVE a property. Have me create a Competitive Market Analysis to show you the approximate value range of the home.. 09) Make an OFFER. We will go over all the required paperwork in order to submit your offer to the Seller. 10) NEGOTIATE terms of the offer. 11) Get your OFFER ACCEPTED. 12) Open ESCROW with Title / Escrow and review the Escrow Process. 13) Review all DISCLOSURES and SCHEDULE HOME INSPECTIONS. 14) Request REPAIRS or CREDIT in lieu of repairs if necessary. 15) Complete the APPRAISAL as required by lenders or optional for Cash Buyers. 16) Receive FINAL LOAN APPROVAL from the lender or deposit funds for Cash Buyers. 17) Conduct your FINAL WALK of your new home before closing. 18) SIGN your final documents with the Title / Escrow Company. 19) FINALIZE the transfer of title form the Seller to the Buyer. 20) GET THE KEYS / ACCESS to your new home and CELEBRATE! Here is how Buyers Representation Worked In The Past (Prior to August 2024):  Donald Keys has been SELLING HOMES FULL-TIME since 2006. Call or Text him today at (602) 750-1744 to discuss BUYING or SELLING a home or both!   Phoenix New Construction Homes $750,000 or less!Home ValuesHome ValuesThe secret is out! Most people love buying a new construction home for the advantages over resale homes. Right now the new home market is on fire!
Buying a home is one of the most significant financial decisions most people will ever make. Among the many choices you'll face, one of the first is whether to purchase a new home or a resale property. Each option has its own set of benefits, but in recent years, the scales have been tipping increasingly in favor of new home construction. Here’s why building new can be a superior choice. 1. Customization and Personalization One of the most appealing aspects of new home construction is the ability to customize your space to fit your specific tastes and needs. When you build a new home, you have the opportunity to select everything from the floor plan to the fixtures, ensuring that your home is exactly what you envision. In contrast, buying a resale home often involves compromising on certain features or investing additional time and money into renovations and updates. 2. Modern Design and Layout New homes are designed with contemporary lifestyles in mind. They often feature open floor plans, larger kitchens, and more storage space. These designs reflect the way people live today, prioritizing communal areas for family gatherings and entertaining. Older homes, while charming, may have more segmented layouts that can feel dated or impractical. 3. Energy Efficiency Advancements in building materials and technology mean that new homes are far more energy-efficient than older properties. Modern insulation, energy-efficient windows, and state-of-the-art heating and cooling systems can significantly reduce utility bills. Many new homes also come equipped with smart home technology, which can further enhance energy savings and provide greater control over your home environment. 4. Lower Maintenance Costs When you buy a new home, everything is, well, new. This means that you won’t have to worry about major repairs or replacements for a while. The roof, plumbing, electrical systems, and appliances are all brand-new and often come with warranties. In contrast, resale homes may require immediate updates or repairs, leading to unexpected costs and inconvenience. 5. Healthier Home Environment New homes are built with the latest standards for health and safety in mind. This includes the use of non-toxic building materials and paints, improved ventilation systems, and advanced water filtration options. These features contribute to better indoor air quality and a healthier living environment, which is particularly important for families with young children or members with allergies or respiratory issues. 6. Increased Safety Features Modern building codes require new homes to include advanced safety features such as hard-wired smoke detectors, carbon monoxide detectors, and fire-resistant materials. These enhancements provide greater peace of mind and can potentially lower insurance premiums. Older homes may lack these critical safety updates, making them riskier and potentially more costly to insure. 7. Better Resale Value While it may seem counterintuitive, new homes can often command higher resale values than older properties. This is due to their modern amenities, energy efficiency, and overall condition. Buyers are frequently willing to pay a premium for a home that requires fewer immediate repairs and updates. Additionally, newer homes are less likely to have issues that could be uncovered during an inspection, making the selling process smoother. 8. Community Amenities New home developments are often part of master-planned communities that include amenities such as parks, playgrounds, walking trails, and even community centers or pools. These amenities can enhance your quality of life and provide convenient recreational options. Older neighborhoods may lack these modern conveniences or require you to drive to access similar facilities. 9. Warranties and Builder Support When you purchase a new home, it typically comes with a builder's warranty. This warranty can cover various aspects of the home, from structural components to specific systems and appliances, giving you peace of mind. If any issues arise, you can often rely on the builder to address them. Resale homes generally do not come with such comprehensive protection, leaving you to handle any problems that arise. Conclusion... While both new construction and resale homes have their merits, the advantages of new home construction are compelling. From the ability to customize your space and benefit from modern design to enjoying energy efficiency, lower maintenance costs, and enhanced safety features, new homes offer a range of benefits that can lead to a more satisfying and secure homeownership experience. If you value modern living, health, and long-term savings, a new home may be the perfect choice for you. ** DO NOT VISIT A MODEL HOME CENTER without a BUYER'S AGENT representing you! The on-site agent at the model home center represents the SELLER. ** DO NOT VISIT NEW HOME BUILDER WEBSITES - as this often forfeits your representation rights. ** To discuss New Home Buyer Representation, call or text me DONALD KEYS Selling NEW HOMES Since 2006 HomeSmart (602) 750-1744 ** Also I have access to which builders are offering BELOW MARKET INTEREST RATES! ** Donald Keys, selling new and resale homes here with a real estate market update for May 2024. Watch the video above from Brian Buffini, real estate expert for over 25 years.
Brian states, that most Americans believe owning a home is a significant part of achieving the American Dream. But today so many believe the dream is out of reach and that is simply not true. One of the most practical ways to leave a financial legacy is to help an adult child or grandchild buy a home. Tapping into your equity helps build generational wealth for your family. In fact, last year 54% of millennials who purchased a home received help with the down payment. The average homeowner has 40 times the net worth of the average renter. And I’m sure we all want to put our families in that kind of situation. Down payment assistance could help them buy in a neighborhood with better schools, helping your grandkids to get ahead in life. It can even help your family avoid tapping retirement accounts to buy a home. So, if you’re one of the 39% of homeowners who own their home free and clear, maybe you could tap into some of that equity to help the next generation get their start. The number one reason people want to move in 2024 is to be closer to family. And if it’s time for you to downsize, maybe you could relocate to an area where your family acquired a home because you assisted with the purchase. For those of you trying to get on the real estate ladder, maybe it’s time to talk with family about getting some help with your down payment. In the meantime, take steps to get your credit score and savings on the right path. If you have any questions on today’s topic, give me a call and I’ll be happy to help! Feel free to call or text me today. DONALD KEYS Selling Homes Since 2006 HomeSmart (602) 750-1744 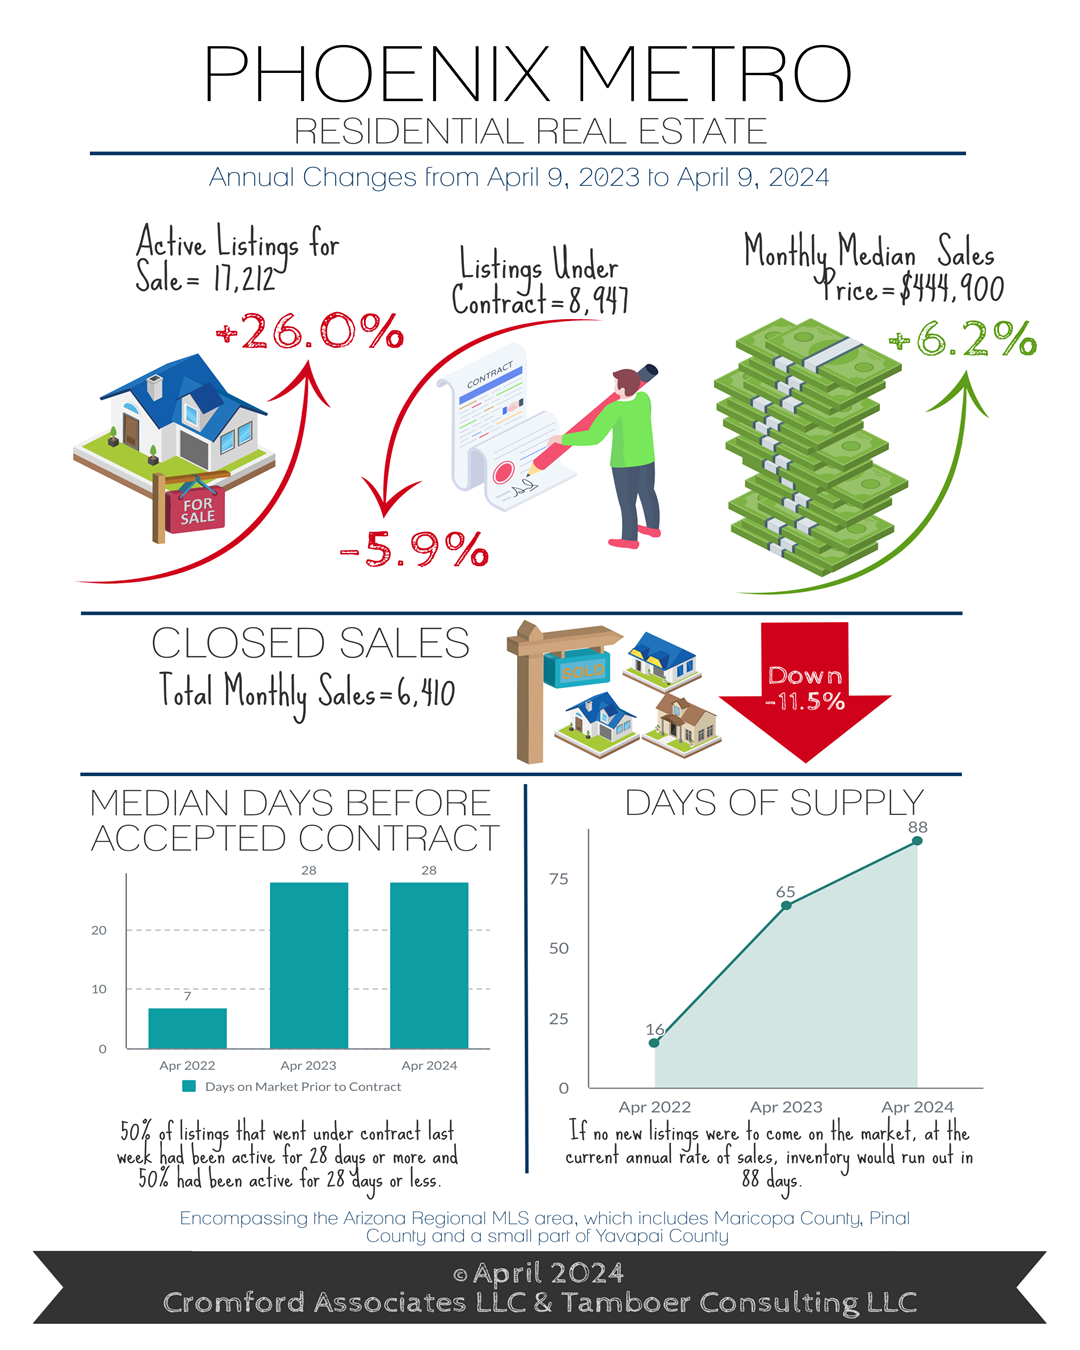 For Buyers:
Inflation is a hot topic today. Talk to any investor about hedging inflation and they may bring up strategies that include gold, commodities, rentals, or even cryptocurrency. For young adults, however, the first step towards hedging inflation is typically moving out of a rental and into homeownership. Let’s discuss why. The Consumer Price Index (CPI) is arguably the most quoted inflation measure in mainstream media. Most readers assume the main driving forces of the CPI are food and energy. They make up 20% of the weight, so that’s a fair assumption. However, it’s shelter costs that are weighted the heaviest of all the categories at 36%, specifically the cost to rent. Nowhere in the CPI does the cost to purchase a home come into the equation because there is no rent to pay if it’s purchased with cash, or the cost is fixed for 30yrs if there’s a mortgage. So, while the Consumer Price Index has increased 12% since June 2022, once shelter is removed the increase is only 2.1%. One could argue that this is the 2-year inflation rate for those who own their primary residence versus rent, which accounts for roughly 64% of all households in Maricopa County. For Sellers: It’s the peak Spring buying season in Greater Phoenix, although it may not feel like it for some sellers. The housing market has begun to drift towards another balanced state over the past 4 weeks, which is the result of an accumulation of supply as demand remains weak. Listings under contract are only down 6% compared to last year, but active listings are up 26%. Days prior to an accepted contract would be 3 weeks at this time of year normally, but current conditions are adding an extra week for sellers. Word on the street is resale homes needing to be remodeled or updated are sitting a bit longer as builders are ramping up permits for new homes. In fact, single family permit activity is up 125% year over year for January and February and sales are up 16%, surpassing 2021 (the previous 10-year high mark). The competition isn’t just for the sub $500K market either. Luxury new home sales over $3M are up 79% so far this year and up 28% between $1M-$3M. The struggle for resale listings that need paint, carpet, or significant changes is fewer traditional buyers have the capacity to finance a remodeling project with current rates, or they may not be able to visualize the space any other way, or they may think the cost and time for basic renovations is greater than it is. As far as investor purchases go, wholesale offers are due to get uglier with increased holding costs, stagnate monthly appreciation, and smaller returns. Flip sales are down 74% from 2 years ago and at a level comparable to 2015. Whether it’s getting quotes for work, renditions to help with visualization, or advising the seller on the most important updates to make prior to listing, it’s markets like this where professional representation and feedback make a difference for both sellers and buyers. Despite current challenges, sellers are averaging 97.8% of their last list price at close of escrow so far this month. Seller-paid closing-cost assistance is down 2% to 44% of sales, and the median sales price increased to $444,900, up 6% from last year. Commentary written by Tina Tamboer, Senior Housing Analyst with The Cromford Report ©2024 Cromford Associates LLC and Tamboer Consulting LLC LOVE OUR INTEREST RATE, BUT THE HOUSE NOT LONGER FITS OUR NEEDS!Do you love your interest rate, but your home no longer suits your needs?
You’re not alone. 82% of homeowners in a recent survey said the same. The good news is, six months ago, rates topped out at 8%. And now we’re averaging in the high sixes. Noted economist Mark Zandi says that rates will finish below six percent this year. Incomes will go up, but home prices will come down a little bit. Why will they come down you may ask yourself? Well, in the coming two years, there will be three million marriages, seven million births and approximately 50M people changing jobs. These are natural reasons for people needing to make a move, and the market will be accelerated by lower interest rates. Our expectation is that by the fourth quarter this year, there will have been three rate cuts. And when rates are lower, we project a significant amount of homes will go on the market. This increase in inventory will create price pressure on homes. So, if you’re actually interested in getting top dollar for your home, right now would be a good time to consider putting it on the market. If you want to discuss strategies for maximizing the value of your home, please give me a call at (602) 750-1744. Donald Keys - Selling Homes Since 2006 - HomeSmart. 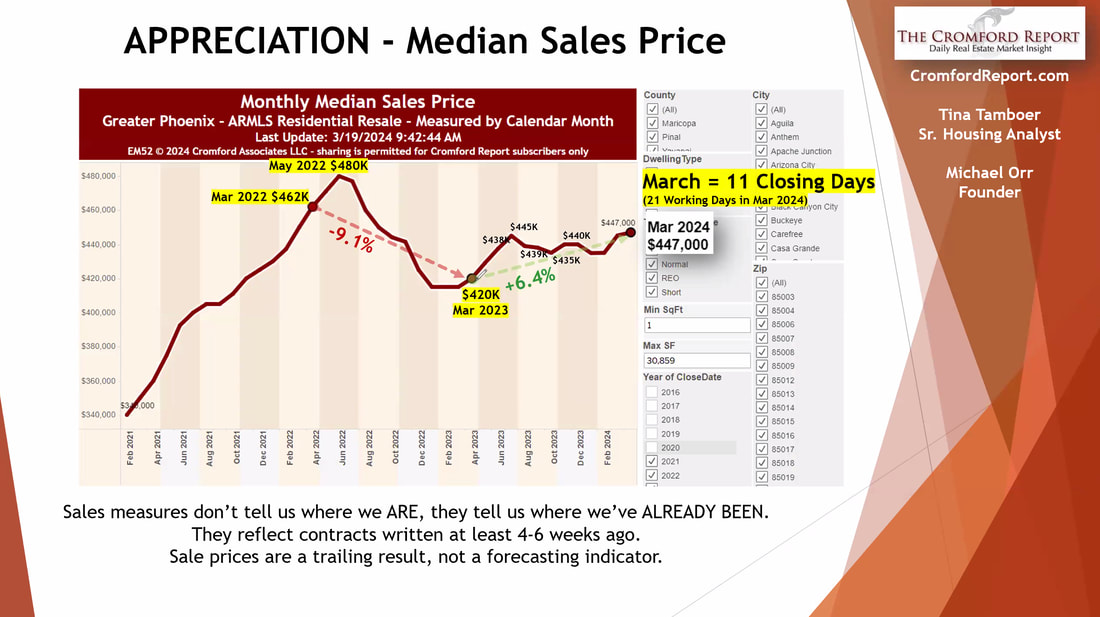 Home Price Up 6.4%!Recently I received a housing update and wanted to share some of the information with you. Home prices in the Phoenix Metro Area are up 6.4% over the last year. In March of 2023 the Median Sale Price was $420,000 and today it is $447,000 a healthy increase. Home prices are expected to continue to increase in 2024 and a projected 13% increase in the number of homes for and new home builders continue to expand their inventory and offer sales back incentives to Buyers. If you have heard the "Home prices are crashing, there is going to be a glut of homes for sale and you better wait to buy..." you may have heard chicken little telling you the sky is falling. The truth is inventory and demand are almost balanced right now and the demand side is increasing as we go into our Spring Selling Season. Looking at the Cromford Market Index, which increased to 114.7 on March 18, 2024 we are in the green and rising. 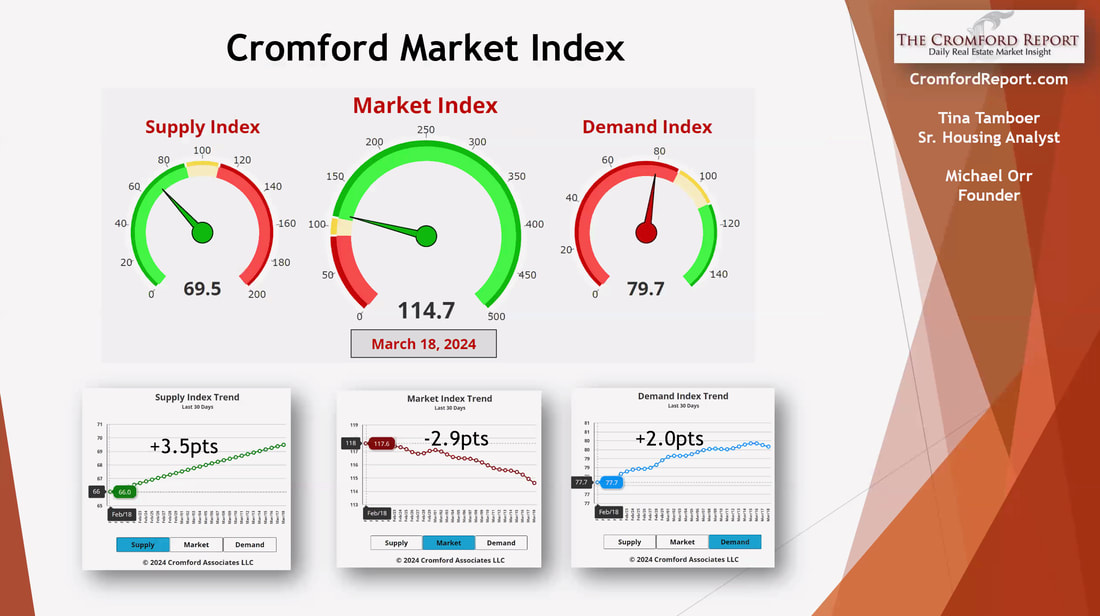 What About Mortgage Rates?Taking a look at mortgage rates, we peaked on October 19, 2023 with a rate of 8.03% and saw a recently low in January 2024 of 6.14%. Since then interest rates have increased to over 7.1% and are expected to remain in the 6.75% to 7.75% for 2024. So if you are waiting for interest rates to come down before you buy a home, that could be a big mistake as home prices are increasing. As interest rates continue to normalize, more homes are being built and more Buyers and Sellers will be on the move, it is best to get your financial house in order now and make a move sooner vs later then there will be more uncertainty and competition. 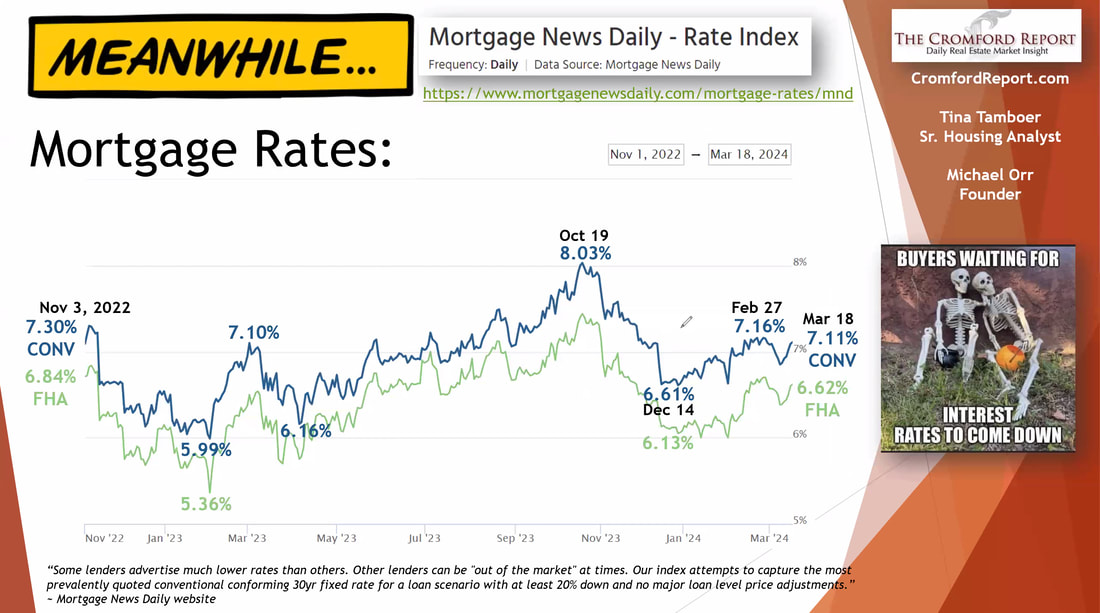 Is NOW The Time To Move? What if I wait?I am often asked "Is now the time to move, should I wait"? And I have always had the same answer and advice: Move when the time is right for you, if you need more space, want to be closer to family, love your interest rate but hate your home or neighborhood, have a new family member, or any other need, then by all means move. Don't wait for lower home price, lower interest rates or the perfect scenario because you will miss the opportunity of a lifetime to improve your life. The sooner you move, the better you will improve your situation. Everything in life evens out. When we purchased our most recent home, even as an Professional Real Estate Agent I was saying to myself "Wow, this home price is really high, I used to be able to get a huge home, a mansion really, in a great neighborhood in Phoenix, for the price of this modest 1,800 sq ft home and now all I get is this?" But looking back just a few years, it was one of the best decision our family made. And comparing to what we would pay for rentt, I look at our mortgage payment and smile. Our neighborhood is great, our neighbors are friendly and our children were able to attend one of the best schools in the area. On top of that our home price has increased, our mortgage balance has decreased , our net worth is higher and our family is happier. So don't wait to move.... just move when the time is right for you! If you or anyone you know has a real estate need (Buying or Selling) call or text me with their name and number. I promise to take good care of them and love your referrals. DONALD KEYS Selling Homes Since 2006 HomeSmart (602) 750-1744 Information courtesy of Arizona's leading authority on the housing market: The Cromford Report.  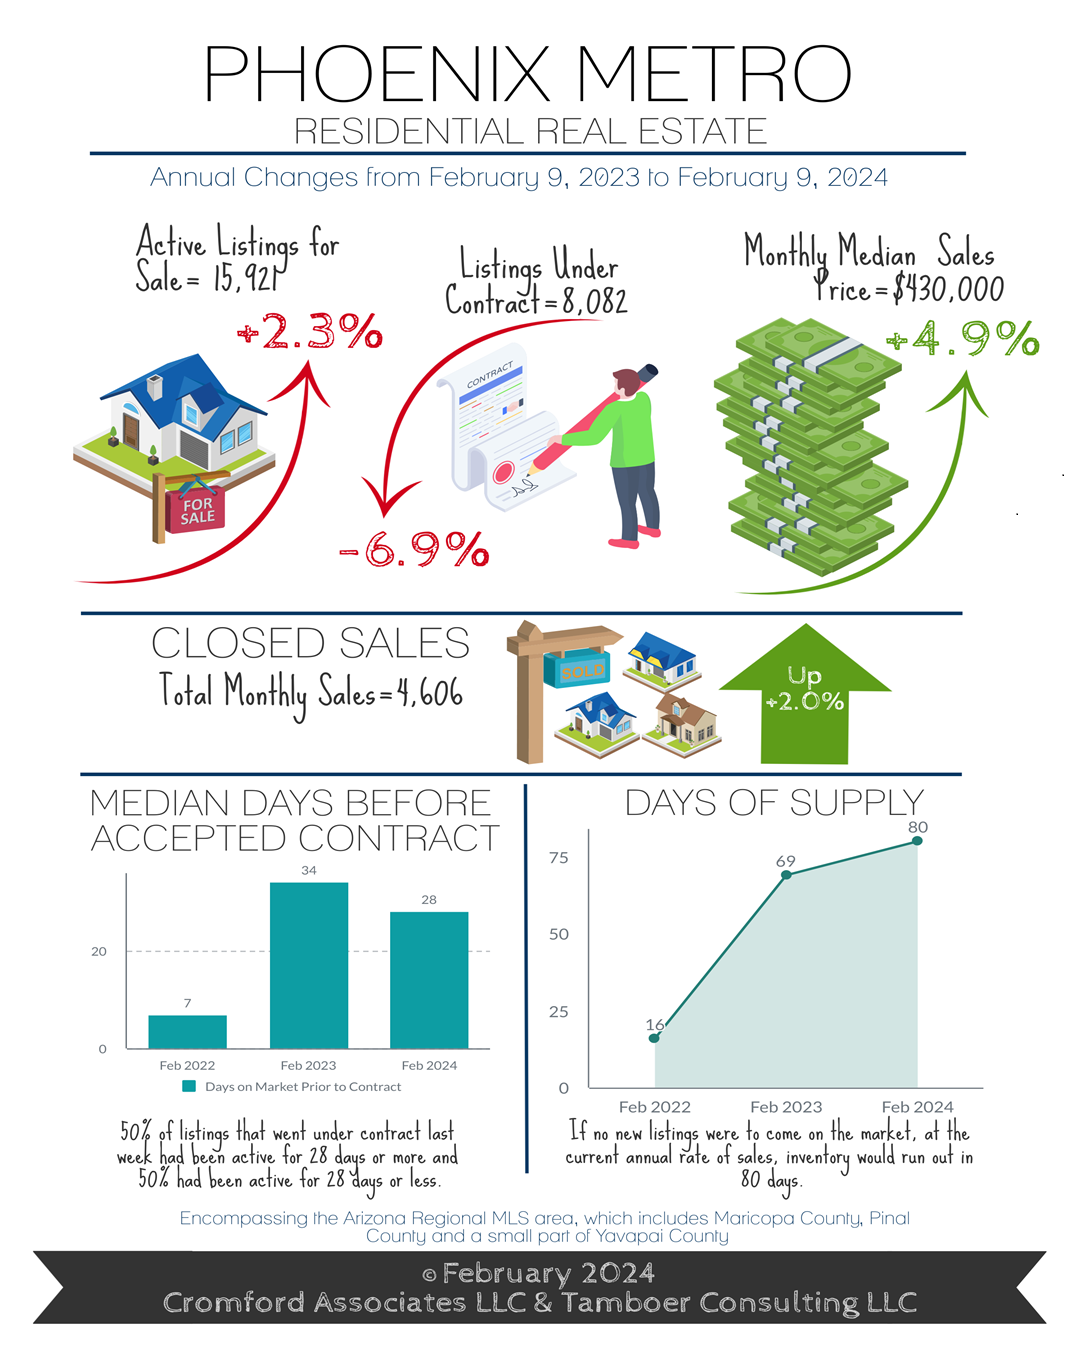 Sellers:
So, what’s to be expected this year? There is one market that can be affected by an election, and that’s the stock market. After the last 4 elections, the stock market has responded positively afterwards, which affects both luxury buyers and retirees with a high percentage of cash purchases. If a cash buyer expects their investment portfolio to be worth more after an election, they may simply put off their home purchase until the Spring. This can cause contract activity to stagnate for a couple months, but not enough to affect prices, and this mild affect can be offset by other mitigating factors, like seasonality, that would make the impact unnoticeable. So far in 2024, listings under contract over $1M are higher than 2022, which is the #1 record year for this price range. Active listings over $1M are also at record highs, which is offsetting the increased demand and keeping price appreciation stable. Retirement communities are not experiencing the same however, as this segment is highly sensitive to inflation. When prices for necessities are high and uncertain, many buyers in this segment will choose to keep their cash for safekeeping. Buyers: With many existing homeowners comfortably staying put these days, more attention is placed on first-time home buyers, affordability, and supply of homes. The first thing that comes to mind is the choice between renting and buying. According to RealData the median cost of a 3-bedroom apartment at a 50+ unit complex in Q2 2023 was $2,100 per month in Maricopa County. The median size is roughly 1,250 square feet. The past 30 days of sales show the median sale price of a 1,200-1,500 square foot, 3+ bedroom single family starter home to be $370,000 in Greater Phoenix. Many first-time home buyers put down 3.5% on a FHA loan ($13,000 on $370K), and last month nearly 70% in this price range had a seller or builder agree to contribute to closing costs with a rate buydown. That’s a median contribution of $10,000 from the sellers. On February 1st, the average FHA rate was 6.0% according to Mortgage News Daily. With a 2/1 buydown from the seller, the first year estimated payment would be $2,159 per month, including taxes, insurance, and PMI. A permanent 1% buydown would equate to $2,375 per month. This puts the monthly cost to buy a small starter home within a few hundred dollars of the median rental rate. Condensed Commentary written by Tina Tamboer, Senior Housing Analyst with The Cromford Report ©2024 Cromford Associates LLC and Tamboer Consulting LLC |
AuthorDonald Keys has been selling homes full-time since 2006. Archives
June 2024
Categories |
 RSS Feed